

Sai Alekhya Chandramouli

Aurora, IL

Sai Alekhya Chandramouli

Business Intelligence Analyst & Developer

I am a Business Intelligence Analyst & Developer with 4+ years of experience building BI solutions and reporting platforms across financial services, insurance and technology. I connect SQL, data modeling and visualization into dashboards people can trust.

A

About

I build business intelligence: Power BI and Tableau dashboards, semantic models, reusable reporting datasets and the SQL and ETL/ELT workflows that feed them. My work spans financial services, insurance and technology.

What drives the work is trust in the numbers: consistent KPI definitions, validated and reconciled data, and models that stay fast as reporting needs grow. I like turning stakeholder requirements into specifications that a dashboard can be tested against.

Beyond my day job I build side projects, from lineage and consent tooling to a SQL engine in Rust, to understand how data systems behave under the hood.

Discipline
Business Intelligence & Analytics
Current employer
PNC
Base
Aurora, IL
Experience
4+ years
Core tools
SQL, Power BI, Tableau, Excel, Power Query
B

Experience

Nov 2024 – Present Current
USA

Business Intelligence DeveloperPNC

  • Develop Power BI and Tableau dashboards, semantic models and KPI solutions supporting 3 core business areas and recurring management reporting.
  • Engineer advanced SQL (CTEs, window functions, stored procedures, views) to build reusable reporting datasets supporting 5+ recurring reporting workflows.
  • Optimize SQL queries, data models, refresh processes and dashboards, improving selected reporting workflow execution by approximately 15–20%.
  • Automate data validation and reconciliation while establishing consistent KPI definitions and business rules across multiple reporting workflows.
  • Support UAT, deployment, production troubleshooting and Agile/Scrum releases with 5+ stakeholder groups across finance, operations and product.
  • Power BI
  • Tableau
  • Window Functions
  • Stored Procedures
Apr 2024 – Oct 2024
USA

Data EngineerMicrosoft

  • Developed and maintained ETL workflows using Azure Data Factory and Azure Synapse Analytics for enterprise reporting and data integration.
  • Wrote and optimized SQL queries, tables, views and stored procedures, reducing reporting errors by approximately 35%.
  • Troubleshot schema inconsistencies and resolved performance bottlenecks across development, testing and UAT environments.
  • Performed ETL testing, database validation and data integrity checks in UAT to verify data accuracy before deployment.
  • Collaborated through Git workflows, code reviews and release validation to support reliable deployments and minimize production defects.
  • Azure Data Factory
  • Azure Synapse Analytics
  • ETL
Sep 2023 – Mar 2024
USA

Business Intelligence AnalystAllstate

  • Analyzed insurance, claims, policy, customer and operational data across 5 key data domains using SQL, Excel, Power BI and Tableau.
  • Developed recurring Power BI and Tableau dashboards covering claims, policy, customer service and operational KPIs across 4 business areas.
  • Automated recurring reporting with SQL, Excel and Power Query, reducing manual report preparation by approximately 20%.
  • Translated stakeholder requirements into KPI definitions, dashboard specifications and analytical deliverables.
  • Applied trend, variance, segmentation and root-cause analysis, validating findings against source data.
  • Power BI
  • Tableau
  • Power Query
Jun 2019 – Jun 2021
India

Data AnalystHexaware Technologies

  • Prepared operational data extracts and recurring reports supporting weekly and monthly business reporting requirements.
  • Cleaned and transformed multi-source datasets using SQL joins, aggregations, subqueries and filtering.
  • Automated repetitive Excel and SQL reporting with Power Query and reusable queries, reducing manual preparation effort by approximately 10–15%.
  • Performed data checks and reconciliation to identify missing, inconsistent or duplicate records.
  • Maintained operational KPI reports tracking weekly and monthly performance trends.
  • SQL
  • Power Query
C

Projects

Featured

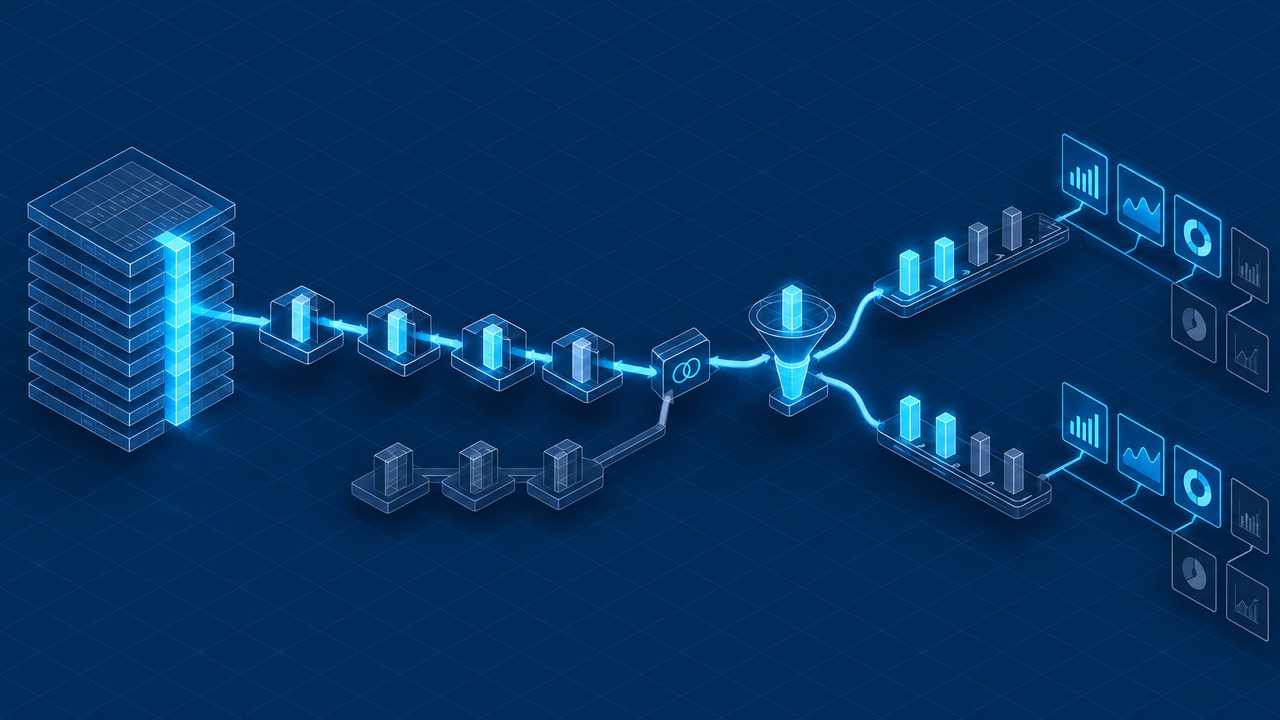
Isometric illustration of a data warehouse feeding a chain of SQL models that split into two dashboard sets
Data lineage

lineagelens

Column-level SQL lineage and impact analysis: given a column you want to change, it lists the downstream columns and dashboards that read it, resolving SELECT *, CTE chains, joins and UNIONs.

  • In the demo, 10 models touch orders, but only 6 columns and 4 of 5 dashboards read orders.discount_pct
  • Unresolvable stars are reported as unresolved rather than silently dropped
  • 18 tests plus a browser demo of dashboard impact
  • Python
  • SQL
  • JavaScript
  • Node.js
  • Mermaid
  • GitHub Actions
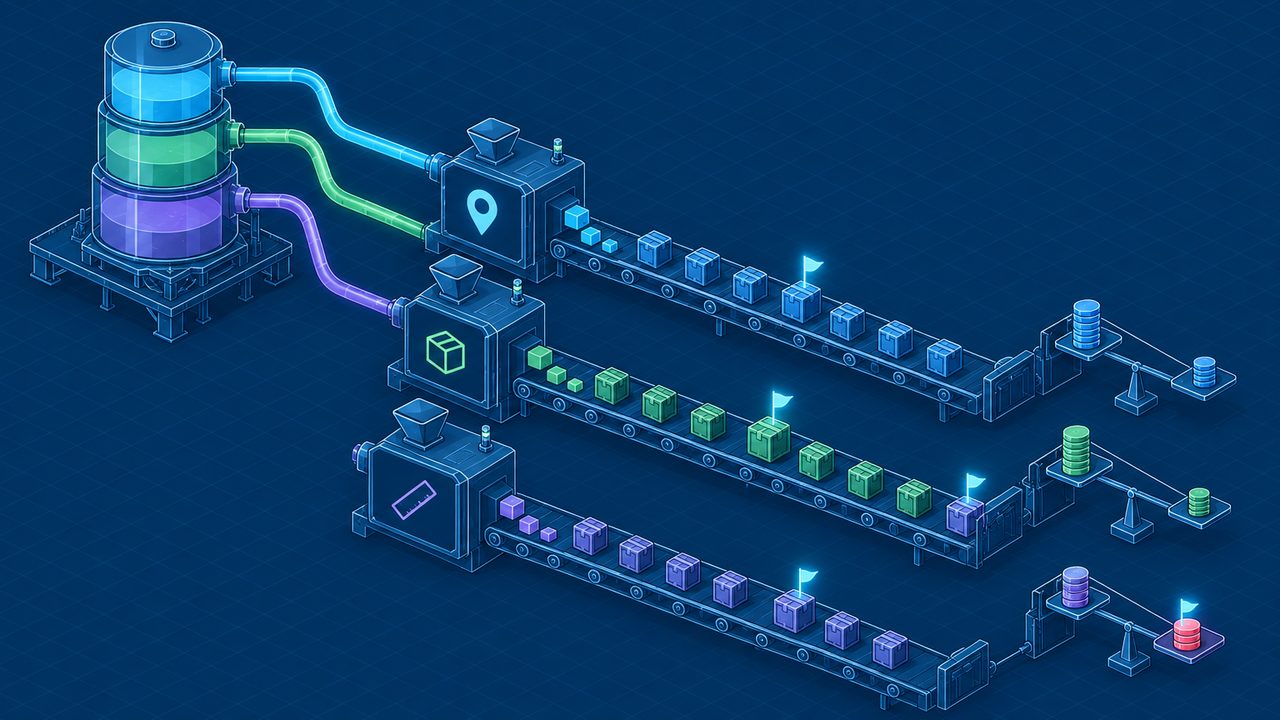
Isometric illustration of cost pools flowing through allocation stages to customer accounts
Financial analytics

costtoserve

An activity-based cost-to-serve model for a parcel carrier that runs the same cost pools under several allocation driver sets and flags customers whose profitability sign flips depending on the driver chosen.

  • 12 of the top 50 accounts by revenue are contribution-negative under activity-based drivers; 19 change sign across driver sets
  • Seven cost pools fully reconciled with zero leakage under every driver set
  • Seeded fixture of 200 customers across three segments, covered by 17 tests
  • Python
  • Activity-Based Costing
  • Sensitivity Analysis
  • GitHub Actions
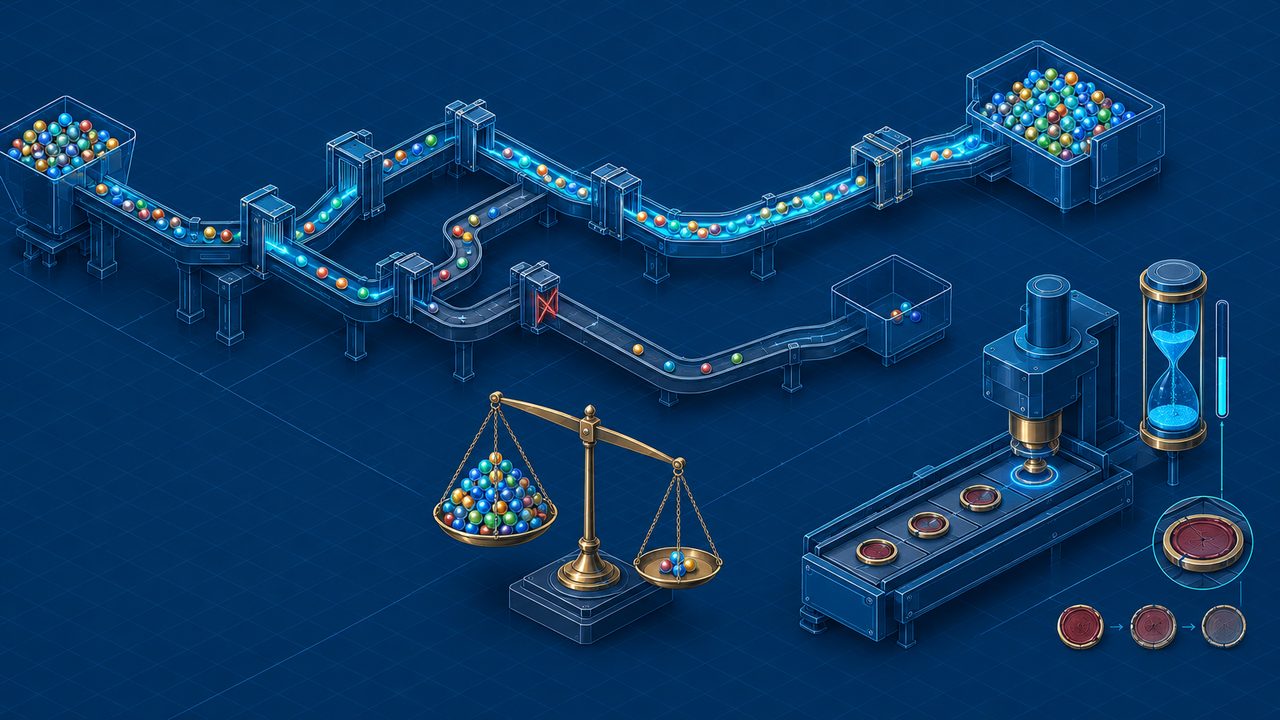
Isometric illustration of customer journeys scored by attribution models against holdout experiments
Marketing analytics

attributiongap

Markov removal-effect marketing attribution scored against simulated holdout experiments, publishing a per-channel bias factor that corrects daily attributed numbers and shrinks as evidence ages.

  • Compares last-click, linear and Markov models against experimental truth across 60,000 simulated users
  • Markov over-credits brand search by 2.34x versus true incrementality
  • Seeded end to end, so repeated runs print identical output
  • Python
  • Markov Chains
  • Attribution Modeling
  • Experimentation
  • GitHub Actions
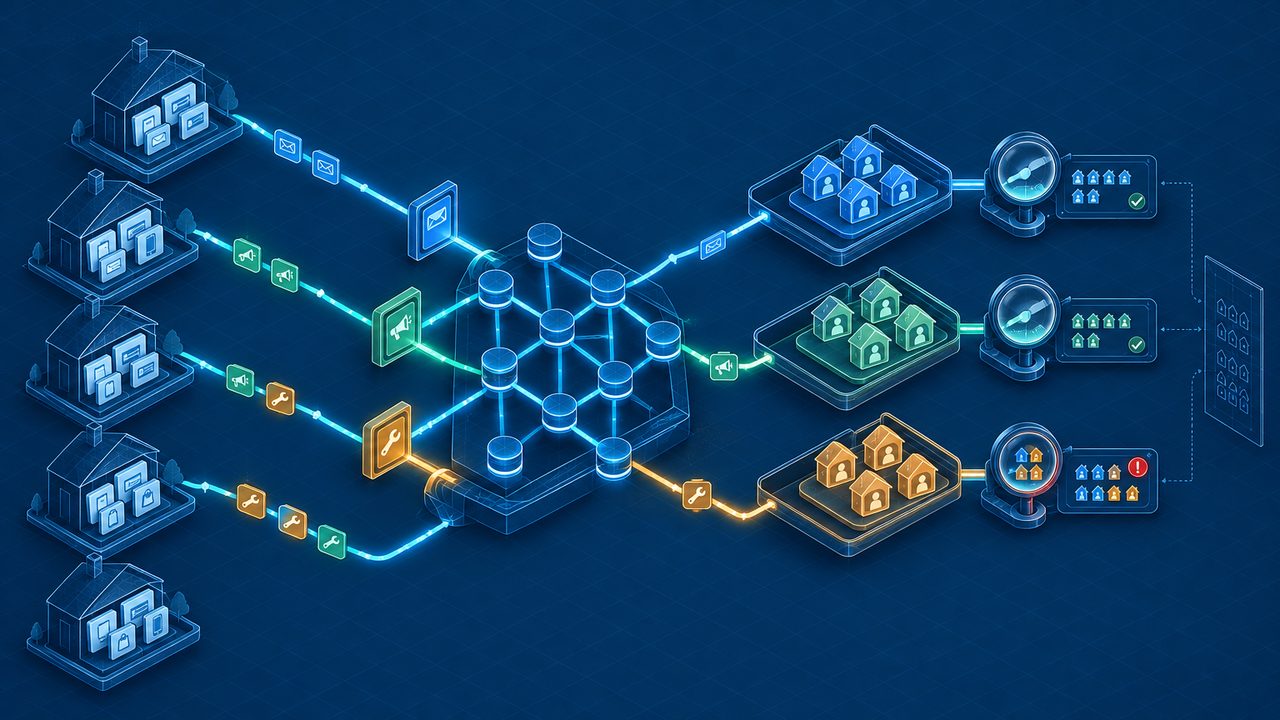
Isometric illustration of customer records linked into a graph, with consent gates controlling each join
Customer data

consentgraph

Identity resolution where per-purpose consent gates the graph join itself, measuring match quality as precision against planted ground truth plus a household-confusion count.

  • Resolves 1,432 records from 300 synthetic households
  • Marketing purposes hold 1.0000 precision with zero household confusions
  • Purpose-scoped traversal via a recursive SQL CTE
  • TypeScript
  • Node.js
  • SQLite
  • SQL
  • GitHub Pages

More projects

  • ratevault

    A motor insurance quote engine with bitemporal rate tables, so any past quote reprices exactly alongside the premium as corrected by backdated changes.

  • erasure

    GDPR erasure driven by column-level lineage across data stores, verified by an adversary that tries to re-identify the deleted person.

  • streamguard-cdc

    A change-data-capture pipeline from Postgres through Debezium and Kafka into ClickHouse, with a Python stream processor.

  • quarry

    A vectorized SQL query engine over Apache Arrow written in Rust, checked against SQLite.

  • enterprise-customer-management-platform

    A B2B CRM on a Spring Boot API and React app, deployed to AWS ECS Fargate with Terraform.

  • blastgraph

    Cloud IAM analysis that builds a privilege graph and finds multi-hop escalation paths to crown-jewel resources.

D

Skills

Business Intelligence

  • Power BI
  • Tableau
  • KPI Reporting
  • Semantic Models
  • Data Visualization

SQL & Database

  • SQL
  • Stored Procedures
  • Views
  • CTEs
  • Window Functions
  • Joins
  • Aggregations
  • Subqueries
  • Query Optimization

Data Engineering & Modeling

  • ETL/ELT
  • Data Modeling
  • Azure Data Factory
  • Azure Synapse Analytics
  • Reporting Datasets
  • Data Integration
  • Data Profiling

Analytics

  • Trend Analysis
  • Variance Analysis
  • Root-Cause Analysis
  • Segmentation Analysis
  • Operational Analytics
  • Financial Analytics
  • KPI Analysis

Reporting & Automation

  • Excel
  • Power Query
  • Reporting Automation
  • Reporting Standardization
  • KPI Definition
  • Business Rules
  • Data Validation
  • Data Reconciliation

Delivery & Collaboration

  • Jira
  • Confluence
  • Git
  • UAT
  • Defect Tracking
  • Release Management
  • Agile
  • Scrum
E

Education & Certifications

Education

Doctor of Business Administration (DBA), Artificial IntelligenceBelhaven University · Jackson, MS
Aug 2026 – Present In progress

Master of Science, Business AnalyticsLewis University · Romeoville, IL
Aug 2021 – Aug 2023

Certifications

Microsoft Certified: Power BI Data Analyst Associate (PL-300)Microsoft
CompTIA Data+ (DA0-002)CompTIA

Contact

Let's build something trustworthy.

Looking for someone to build trustworthy dashboards, semantic models and reporting pipelines? I'd be glad to hear from you by email, phone or LinkedIn.